Blog

Consumer Food Insights - April 2023

The latest edition of our monthly Consumer Food Insights survey is now out. They report conveys the results of the survey conducted in the latter part of April 2023. Here are some of the main findings.

  • 55% of consumers shopped at a dollar store in the past 30 days

    • Most commonly (30%+) bought snack foods, candy, beverages

    • About 25% did not purchase food

    • Consumers tend to live closer to a dollar store than they do to the place they do most of their grocery shopping

    • About half of consumers said they’d be more likely to shop at a dollar store if it had a more full service grocery section that sold, e.g., fresh fruits and veggies

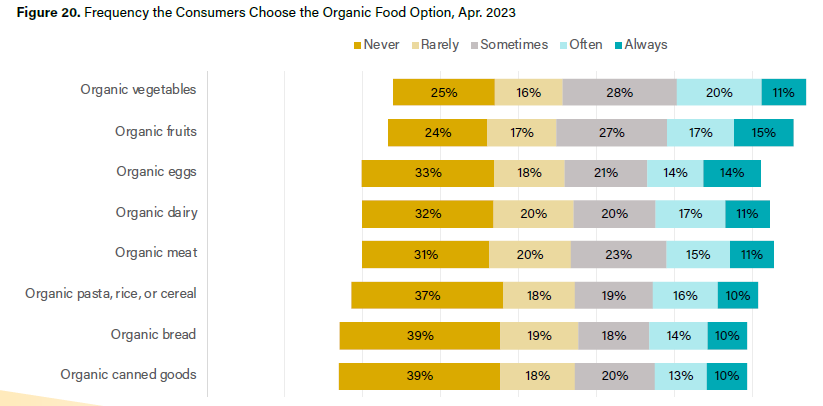
  • This month, we asked how often people purchased different types of organic foods (see the figure above).  The most commonly bout organic food items were organic vegetables and organic fruits, but even for this just over 30% said they often or always bought organic.  The least common categories for organic purchase was pasta, rice, and cereal, bread, and canned goods; for these almost 60% said they never or rarely buy organic.

  • In terms of our regular tracking questions, we find the following.

    • Total food spending is up 7% year over year

    • Consumers report lower rates of food price increases than they have in previous months.

    • Virtually no change in food insecurity.

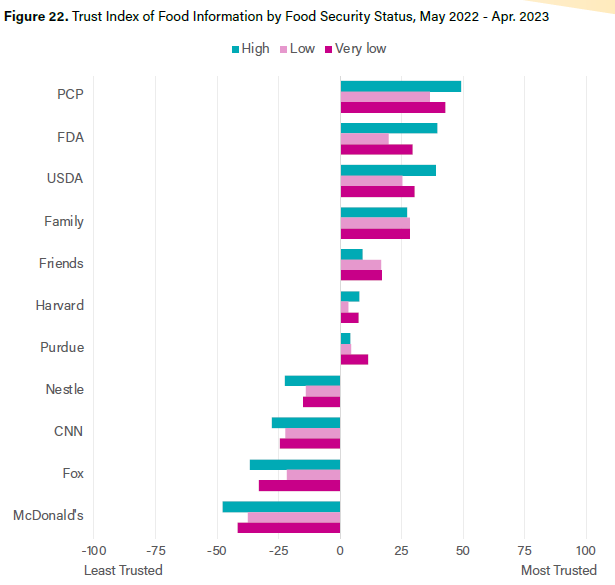
  • We decomposed many of our survey results by people that were high, low, or very low in terms of food insecurity status. Compared to food secure households, households experiencing food insecurity …

    • had lower sustainable food purchase scores,

    • placed more weight on affordability when buying food,

    • were much more likely to be on SNAP and wait to buy groceries or eat out until their next paycheck,

    • were less likely to be happy with their diets and overall lives (although they remained fairly happy overall), and

    • less likely to trust food-related information from FDA and USDA.

Data Dashboards for Spending at Food Retailers and Dollar Stores

We continue to add new dashboards on our Center for Food Demand Analysis and Sustainability (CFDAS) web page. We have added two new dashboards added in the past week. One on spending at dollar stores (includes Dollar General, Dollar Tree, and Family Dollar) and another on general retailers (includes Walmart, Target, and K-Mart).

Here is an example of the general retail dashboard with Walmart selected.

We now have almost 20 data dashboards that are regularly updating with new data about our food system.

Consumer Food Insights - March 2023

The latest edition of our monthly Consumer Food Insights survey is now out.

We continue to see a fall both in the share of consumers who say they can’t find certain foods when shopping (i.e., stock-out rates are falling; see also my post last week on new research about stock-outs) and who are buying groceries online.

This month, we asked some questions about trust and importance of different food labels. Consumers said the most important labels were expiration date, ingredient list, and nutrition facts panel; the lase important were gluten free claims and religious certifications. Claims about “natural” and “healthy” were the least trusted.

We’ve been tracking trust in information about food from different organizations. In the past, we explicitly avoided listing Purdue, but we had been asking about two other universities: Harvard and Ohio State University (OSU). This month, we replaced OSU with Purdue. Purdue scored a +4, while OSU averaged -4 and Harvard averaged 7 over the past year. I’m not sure whether this means people think Purdue is more trustworthy than OSU, or that people are displaying some social desirability bias, since respondents know Purdue researchers are conducted the survey.

This month, we we broke down our results by employment status, comparing those consumers who are working age and retirement age, i.e., not working (ages 18-64), working (ages 18-64), working (ages 65+), and retired (ages 65+). We find, for example, that 27% of working age adults without a job experienced food insecurity in the last year compared to 12% among those with a job.

For these, and other results, check out the full report here.

Data Dashboard on Grocery Spending

My team at the Center for Food Demand Analysis and Sustainability (CFDAS) at Purdue released a new data dashboard on consumer spending at grocery stores. This does not include spending at general retailers (like Wal-Mart or Target) but just those chains classified as grocery or supermarket.

Tackling and Solving Food Insecurity Through Private Sector Innovations

That’s the title of a new publication the team with the Center for Food Demand Analysis and Sustainability (CFDAS) at Purdue released with Agrinovus Indiana as they launch their HungerTech challenge. The short paper presents data on food insecurity in Indiana alongside factors like broadband access, ruralness, location of dollar stores, and more. We encouraged priorities be focused on the following four issues: Developing and implementing innovative food access solutions for targeted populations, Empowering consumers to make healthy choices, Connecting consumers to food networks, and Creating analytics around food insecurity.

You can read the whole thing by clicking on the document below.